


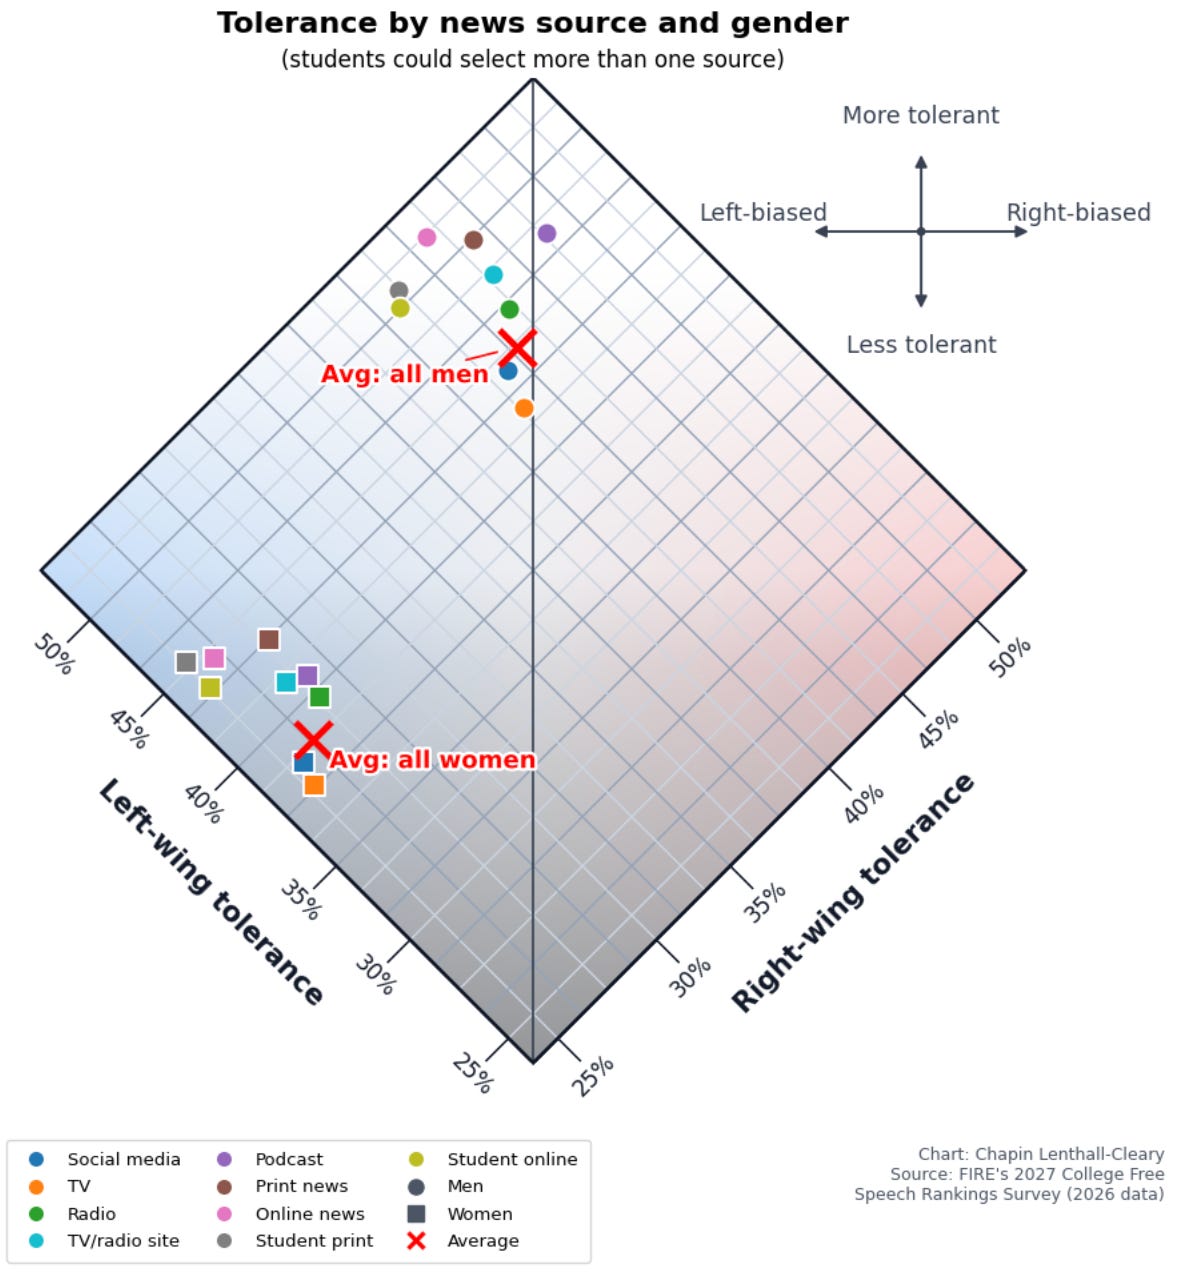
We’ve previously used a tool we call the Free Speech Map to show how tolerant different groups are of hypothetical campus speakers, often as a way to assess how certain traits cause or are linked to tolerance. In our newest College Free Speech Rankings, we asked students where they get their news, including an option for social media. So let’s put that question onto the free speech map:
Regards to Robert Putnam, I guess.
Recall how the diagonal axes combine to form the compass. Higher tolerance for both left and right pushes you upward. A leftward bias (i.e. higher tolerance for the left and lower tolerance for the right) pushes you leftward, and vice versa.
Among both men and women, those who get their news from social media are less tolerant than most other points on the graph. Those who get their news from TV are even less tolerant. By contrast, people who get news from print and online newspapers are unusually tolerant, though only modestly. The same is true of men who get news from podcasts.
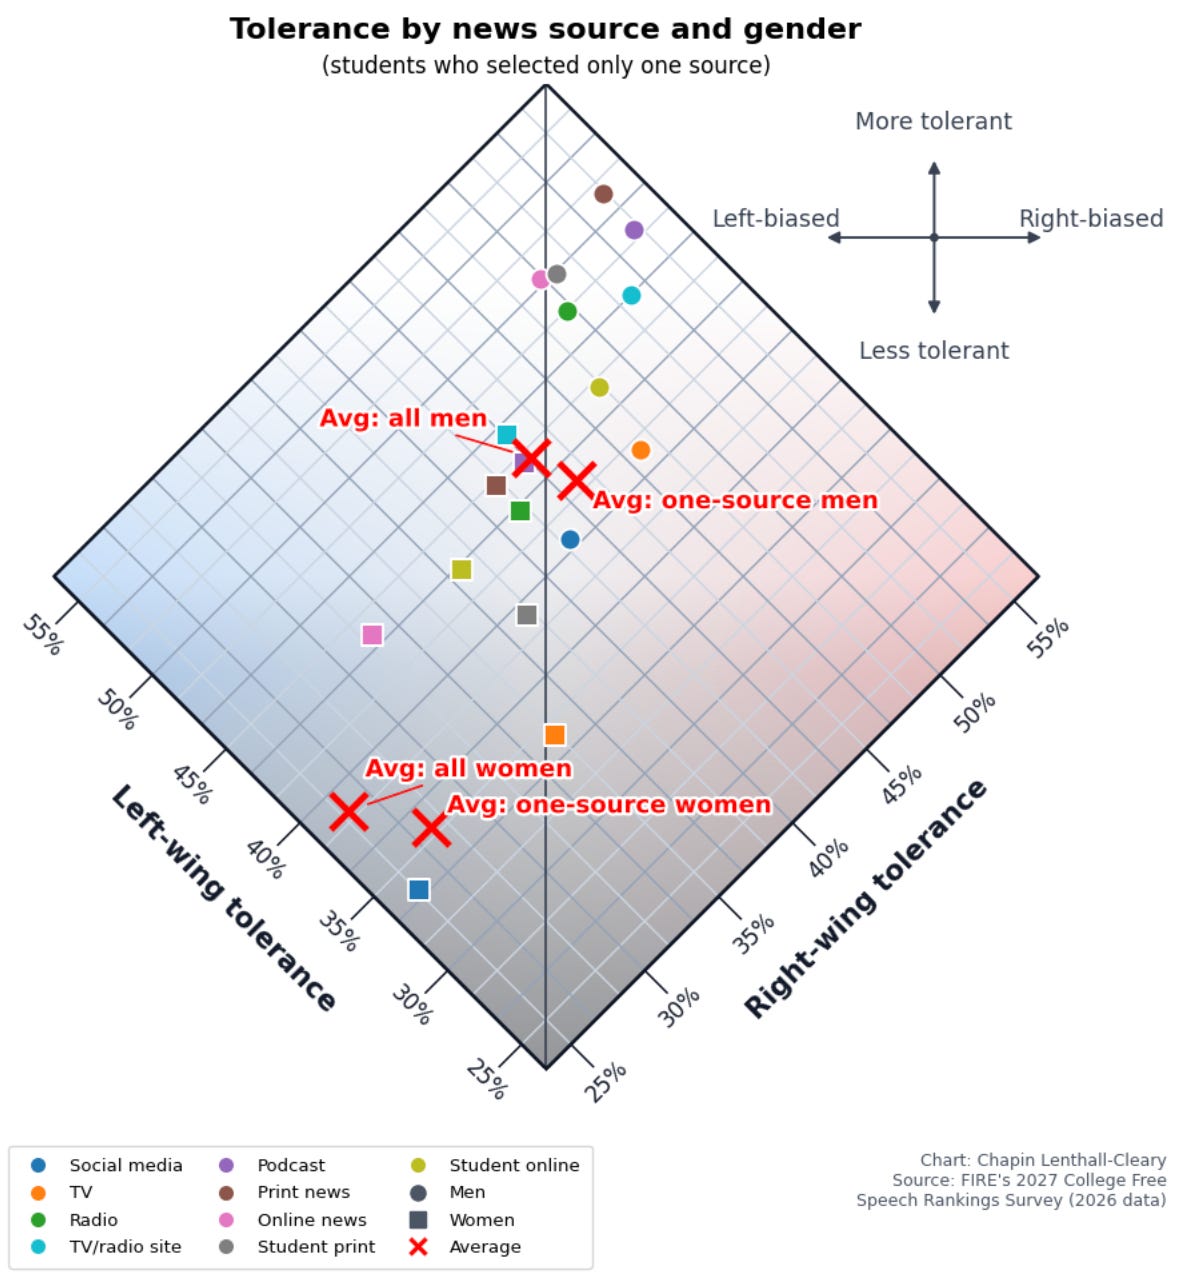
Okay, people are able to select multiple sources here. If we’re interested in understanding the effect that social media has (and other sources have) upon tolerance, we’d arguably get a clearer picture by restricting the plot to students who only selected a single news source:
Get off your damn phone. Yes, you.
When we restrict our analysis to those who only get their news from a single source, the gap between those who get their news from social media and everyone else widens. Getting news from only social media is tied to substantially lower tolerance. To a lesser extent, the same is true of TV.
Another interesting detail: compared to the previous plot, the clusters of points shift right, suggesting that people who get their news from a single source are more likely to be right-biased (or less left-biased) in their tolerance. Indeed, students who get their news from exactly one source lean more conservative than those who get their news from any other number of sources.

Out of curiosity (and because you should obviously always check sample size in this line of work), how many students are getting their news solely from social media? And…it’s 5,658 men (26%) and 7,374 women (19.7%) — excluding students who’ve quit the survey by this point.
In our sample, a quarter of male students and a fifth of female students get their news only from social media. Interestingly, though men are more likely to get their news from only social media, women are more likely to get news from social media overall (86.1% vs. 90.8%). Men, in other words, are more likely to occupy both extremes on this subject (i.e. relying solely upon social media for news or not getting news there at all). Also note that many of the points on the one-source-only plot have small sample sizes and should be treated as fairly uncertain (social media, online news, and the averages look reliable; the others are hard to tell).
These results certainly don’t prove that social media use causes intolerance. But they do suggest a possible significant contributor to the dismal state of free speech and open discourse on college campuses (and society at large). And likewise, this potential source of intolerance points us towards a possible avenue for improving these issues.
The code, data, and codebook used to generate these plots are available here.
